Diamond graders draw a diagram of the inclusions in the diamond (left) to a diagram (right) to create a map of the diamond’s inclusions, called the “plot”. The plot will be used to help the diamond lab give the diamond its final grade on the clarity scale.
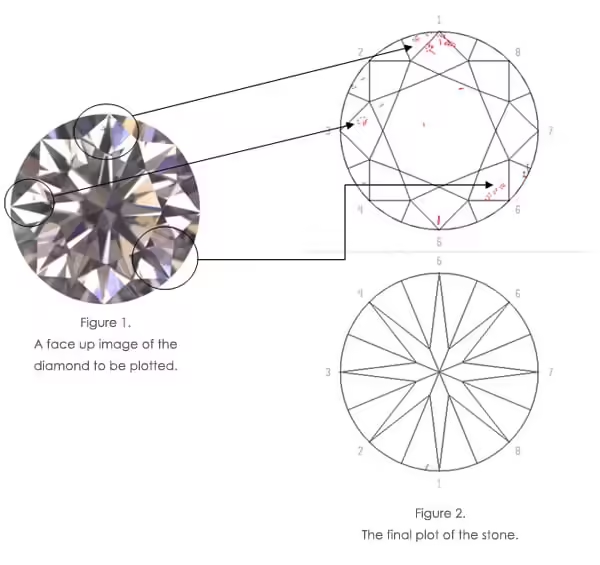
A stone plot on a diamond grading report is a bit like a fingerprint. It records the significant internal and external characteristics of the diamond as a way to help positively identify that diamond and justify its clarity grade. Every diamond is unique!
Translation plane
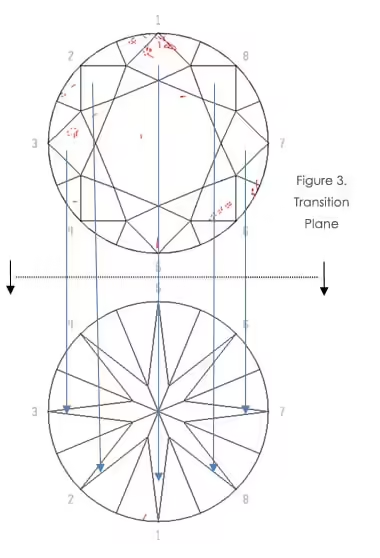
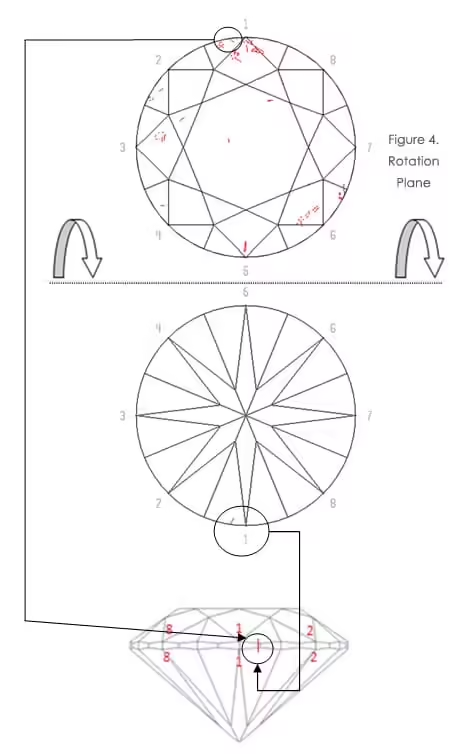
Figure 4. This is how plots are traditionally oriented. Note that the feather in bezel #1 also breaks through the girdle to the upper half on the left #1 lower half.
L